Peptide Molecular Weight Verification Steps for Researchers
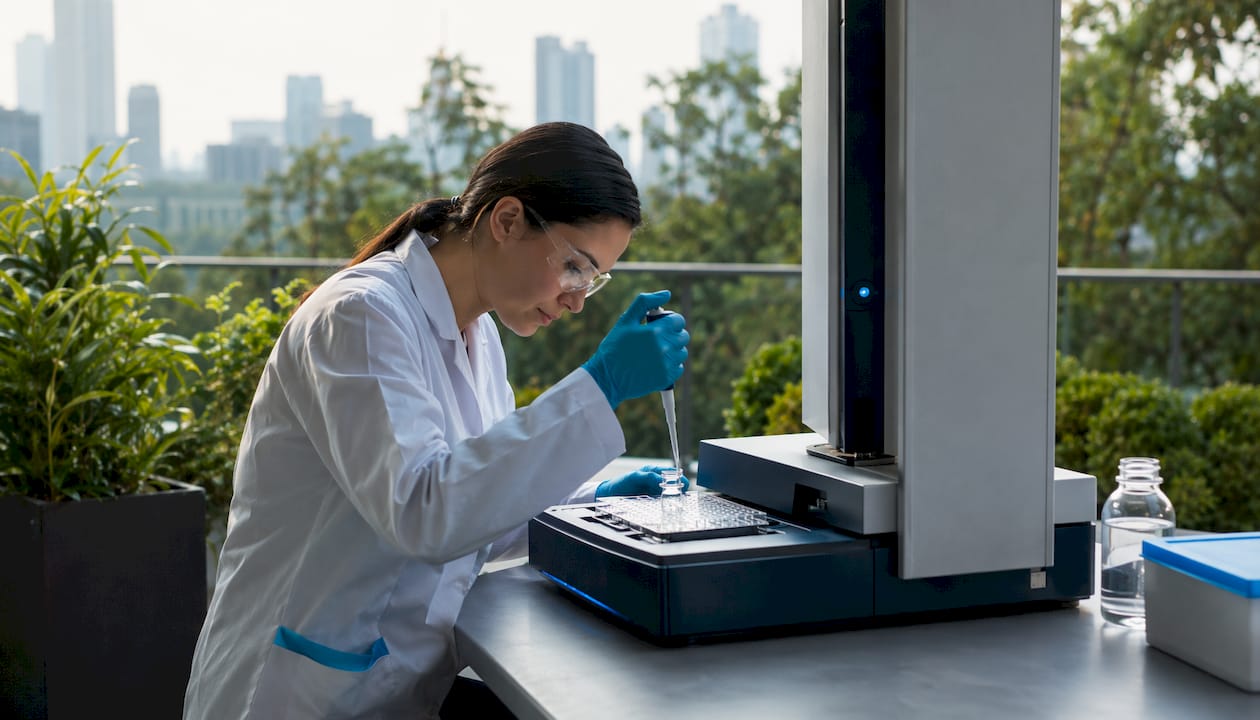
The fastest reliable path to verify a peptide’s molecular weight is mass spectrometry, specifically MALDI-TOF for a quick intact-mass check or LC-ESI-MS when charge-state resolution and higher mass accuracy are required. Before running any instrument, calculate the theoretical mass, clean up the sample, and confirm which mass mode your COA reports. Here is the core checklist:
Calculate theoretical mass using the correct mode: monoisotopic for high-resolution MS, average mass for bench weighing. Use the formula MW = Σ(residue masses) + 18.015 Da for the terminal water, and account for any modifications manually.
Prepare and desalt the sample. Remove salts, TFA, and buffers that suppress ionization or generate adduct peaks.
Run MALDI-TOF for a fast singly charged intact-mass read. Accept results within ±1 Da of theoretical.
Run LC-ESI-MS (Q-TOF or Orbitrap) when higher accuracy is needed. Accept results within 5 ppm for high-resolution instruments.
Run an orthogonal check (SDS-PAGE, Tricine gel, or capillary electrophoresis) if the MS result is ambiguous or if multimers are suspected.
Escalate to MS/MS peptide mapping when intact mass alone cannot resolve isobaric modifications, suspected truncations, or sequence errors.
Document everything: sequence, theoretical mass (specify monoisotopic or average), observed mass, instrument type, acquisition settings, mass accuracy in ppm or Da, HPLC purity trace, and raw spectra files.
Pro Tip: The single most common false mismatch in peptide molecular weight verification steps occurs when a high-resolution instrument reports monoisotopic mass but the COA lists average mass. The difference for a 2,000 Da peptide can exceed 1 Da, which looks like a failed result. Always confirm which mass type the COA and your calculation tool report before concluding there is a discrepancy.
Table of Contents
What does the end-to-end verification workflow look like?
Which MS method should you use: MALDI-TOF, LC-ESI-MS, or MS/MS?
How does electrophoresis complement MS for peptide verification?
How should you prepare samples and use HPLC before running MS?
When does intact mass fail, and how does peptide mapping fill the gap?
How do you calculate theoretical mass and set acceptance criteria?
How do you troubleshoot common mass discrepancies?
What belongs in a COA and internal QC record for mass verification?
Concise lab protocol: MALDI spotting, LC-ESI injection, and MS/MS setup
What should you demand from suppliers for independent mass verification?
Key Takeaways
The gap between purity claims and actual identity confirmation
PeptidesFromChina: manufacturer-side sourcing for researchers
Useful sources and calculation tools
What does the end-to-end verification workflow look like?
The recommended flow moves from theoretical calculation through sample preparation, then to instrument selection based on the scenario at hand, and finally to documentation. Choosing the wrong first-line method wastes sample and time, so the decision should be made before the vial is opened.
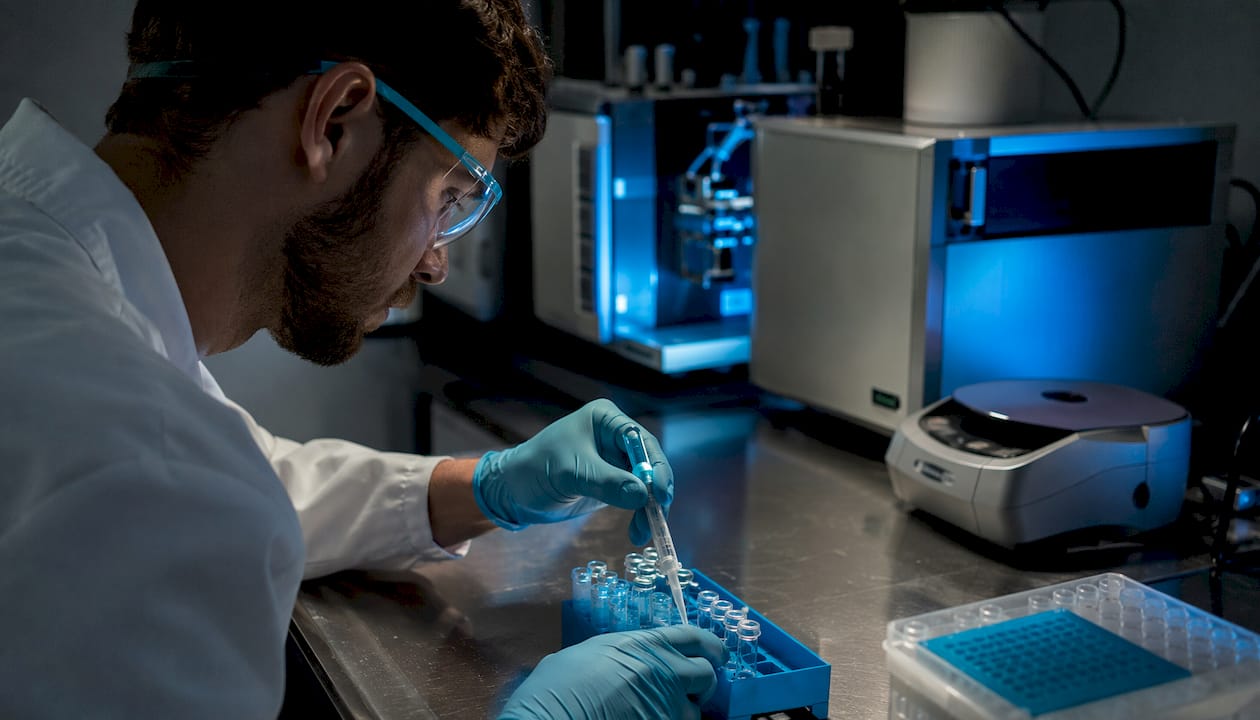
A practical lab workflow favors an initial quick MALDI check for intact mass, followed by LC-ESI when adducts or charge states complicate interpretation. The table below maps common scenarios to the appropriate first-line method and follow-up action.
Scenario First-line method Follow-up if ambiguous Small unmodified peptide (<3 kDa), sufficient sample MALDI-TOF LC-ESI-MS if adducts present Modified peptide (PEGylated, acylated, phosphorylated) LC-ESI-MS (Q-TOF or Orbitrap) MS/MS peptide mapping Low sample quantity (<1 nmol) LC-ESI-MS (nano-ESI) Targeted MS/MS (PRM/SRM) High salt or buffer contamination SPE desalt → MALDI or ESI Repeat after cleanup Suspected truncation or wrong sequence LC-ESI-MS intact mass MS/MS peptide mapping Multimer or aggregation suspected SDS-PAGE / CE orthogonal check LC-ESI-MS after denaturation
Timeline expectations are worth setting explicitly. Sample preparation and desalting typically require some time. A MALDI acquisition and basic interpretation usually takes a short duration. An LC-ESI-MS run with a typical gradient adds additional time including data processing. MS/MS peptide mapping with database searching can require a significantly longer period, particularly when de novo sequencing is needed.
Instrument access and deconvolution software are the two most common bottlenecks in verification workflows. Pre-booking instrument time and confirming software licenses before the sample arrives at the bench prevents the most avoidable delays.
For pre-run mass calculation, the Thermo Fisher peptide analyzing tool reports both monoisotopic and average mass alongside pI and hydrophobicity, which helps confirm that the peptide is compatible with the planned MS workflow before any instrument time is committed.
Typical mass tolerances by instrument class: MALDI-TOF ±1 Da; ESI Q-TOF <5 ppm; Orbitrap <5 ppm. High-resolution instruments set the tightest acceptance window, making them the preferred choice when modification mass shifts are small and must be distinguished from noise.

Which MS method should you use: MALDI-TOF, LC-ESI-MS, or MS/MS?
Mass spectrometry is the primary tool for confirming peptide molecular weight. MALDI-TOF produces predominantly singly charged ions, making spectral interpretation straightforward and fast. LC-ESI-MS generates multiply charged ions across a charge-state envelope, which allows deconvolution to a more accurate neutral mass and is better suited to modified or larger peptides.
MALDI-TOF vs. LC-ESI-MS: practical differences
MALDI tolerates moderate sample heterogeneity and works well with dried-droplet or thin-layer matrix preparations. Its main limitation is salt sensitivity: sodium and potassium adducts ([M+Na]⁺ at +22 Da, [M+K]⁺ at +38 Da) dominate spectra when sample cleanup is incomplete. ESI is more sensitive to ion suppression from residual TFA or phosphate buffers but handles a wider mass range and produces the charge-state series needed for accurate deconvolution of larger peptides.
Parameter MALDI-TOF LC-ESI Q-TOF / Orbitrap Ionization Laser desorption, matrix-assisted Electrospray, solution-phase Typical charge state Singly charged [M+H]⁺ Multiply charged [M+nH]ⁿ⁺ Mass accuracy ±0.1–1 Da <5 ppm (high-res) Salt tolerance Moderate (desalt recommended) Low (desalt required) Best peptide size range 500 Da–10 kDa 200 Da–50+ kDa Matrix / solvent CHCA or DHB in ACN/water/TFA 0.1% formic acid in ACN/water Acquisition time 5–15 min 20–60 min (with LC)
Instrument settings for reproducible results
For MALDI, use α-cyano-4-hydroxycinnamic acid (CHCA) matrix at a 10 mg/mL concentration in 50% acetonitrile / 0.1% TFA. Laser energy should be set just above the ionization threshold to minimize fragmentation. Acquire at least 200 laser shots per spectrum and calibrate externally with a peptide calibration mixture bracketing the expected mass range.
For LC-ESI on a Q-TOF or Orbitrap, standard starting parameters include a spray voltage of 3.0–3.5 kV, capillary temperature of 300–320°C, and a scan range of 200–2,000 m/z. Use a C18 reverse-phase column (1.7–1.8 µm particles, 2.1 × 50 mm) with a gradient from 5% to 95% acetonitrile in 0.1% formic acid over 10–20 minutes at 0.3 mL/min.
For deconvolution, software such as Bruker DataAnalysis, Waters MassLynx, or Thermo Xcalibur can reconstruct the neutral mass from the charge-state envelope. Always verify that the software is set to report monoisotopic mass for high-resolution data and average mass for lower-resolution instruments — mixing these modes is the leading cause of false mass discrepancies in routine QC.
Reading annotated spectra
The base peak in a MALDI spectrum of a clean peptide should be [M+H]⁺. Sodium and potassium adducts appear at +22 Da and +38 Da respectively and indicate incomplete desalting. Oxidation artifacts show as a satellite peak at +16 Da. For ESI data, the charge-state series appears as a cluster of peaks; deconvolution software converts these to a single neutral mass. Peaks that do not fit the expected charge-state spacing indicate co-eluting impurities or in-source fragmentation.
Pro Tip: Set the baseline noise threshold in your peak-picking software conservatively. Peaks below 5% relative intensity are often noise or matrix clusters in MALDI, and including them in the report inflates the apparent complexity of the spectrum without adding useful mass information.
How does electrophoresis complement MS for peptide verification?
Electrophoresis is an orthogonal, low-cost check for size-range confirmation and for detecting multimers or gross truncations, but it lacks the mass precision of MS. No gel system resolves mass differences below roughly 500 Da for small peptides, so electrophoresis should never replace MS as the primary verification method.
Choosing the right gel system
Standard SDS-PAGE (12–15% acrylamide) resolves peptides above approximately 5 kDa. For smaller peptides in the 1–5 kDa range, Tricine-SDS-PAGE is the appropriate choice: its discontinuous buffer system and higher acrylamide concentrations (16–20%) provide resolution that standard glycine-based systems cannot achieve. Capillary electrophoresis (CE) offers quantitative peak areas and better reproducibility than slab gels, making it useful when a numerical purity estimate is needed alongside size confirmation.
Tricine gels are the standard for peptides below 5 kDa. Running a small peptide on a standard glycine SDS-PAGE system and observing no band is not evidence of absence — the peptide has likely run off the gel entirely.
Practical loading and staining guidance
Load a small amount per lane for Coomassie staining; use a much lower amount per lane for silver staining, which is greatly more sensitive but prone to background artifacts with hydrophobic peptides. Always include a low-molecular-weight marker that covers the expected mass range of the peptide. Smearing or diffuse bands typically indicate residual salts, hydrophobic aggregation, or incomplete denaturation rather than a true mass distribution.
Pro Tip: Boil samples in SDS loading buffer for 5 minutes and add 5% β-mercaptoethanol when disulfide-bridged peptides are suspected. Skipping reduction produces anomalously fast-migrating bands that can be mistaken for truncations.
How should you prepare samples and use HPLC before running MS?
Trustworthy MS data depends on proper sample cleanup. Residual salts, ion-pairing agents like TFA, and incompatible buffers suppress ionization and generate adduct peaks that obscure the true mass. Desalting using solid-phase extraction (SPE) or HPLC fractionation, followed by reconstitution in an MS-compatible solvent, is not optional for reliable results.
Analytical HPLC is necessary for purity assessment but cannot verify sequence identity. A COA showing 98% HPLC purity does not rule out a co-eluting wrong-sequence impurity. MS is required to confirm molecular identity even when HPLC purity appears high. For complementary guidance on how HPLC, LC-MS, and NMR each contribute to peptide QC, the HPLC, LC-MS, and NMR analysis guide provides a useful method-by-method breakdown.
Standard analytical HPLC gradient for pre-MS cleanup
Use a C18 reverse-phase column (4.6 × 150 mm, 5 µm particles) for analytical runs. A typical gradient: hold at 5% acetonitrile in 0.1% TFA for 2 minutes, ramp to 95% acetonitrile over 20 minutes, hold for 3 minutes, re-equilibrate for 5 minutes. Flow rate: 1.0 mL/min. UV detection at 214 nm and 280 nm. Collect the target peak fraction for MALDI spotting or lyophilize and reconstitute in 0.1% formic acid for LC-ESI injection.
Desalting checklist
Select an appropriate SPE cartridge: C18 for hydrophobic peptides, mixed-mode cation exchange (MCX) for basic peptides, or C8 for very hydrophobic sequences.
Condition the cartridge with 1 mL methanol, then 1 mL 0.1% formic acid in water.
Load the sample in 0.1% formic acid. Wash with 1 mL 0.1% formic acid to remove salts and TFA.
Elute with 0.5 mL 60–80% acetonitrile in 0.1% formic acid.
Lyophilize the eluate if long-term storage is needed, or inject directly into the LC-ESI system.
Reconstitute lyophilized peptide in 0.1% formic acid / water at 0.1–1 mg/mL. Vortex briefly and sonicate for 30 seconds to minimize aggregation.
Key buffer considerations: formic acid is preferred over TFA for ESI because TFA causes significant ion suppression at concentrations above 0.05%. If TFA was used during synthesis or purification, the SPE wash step removes most of it, but a second wash cycle may be needed for highly hydrophobic peptides.
When does intact mass fail, and how does peptide mapping fill the gap?
Use peptide mapping (MS/MS) when intact mass ambiguity remains after standard MS verification. Common triggers include isobaric modifications (deamidation at +0.984 Da is unresolvable on low-resolution instruments), suspected partial modifications, or a mass discrepancy that does not match any single known adduct or modification.
Peptide mapping development follows four canonical steps: isolation and purification of the intact peptide, selective enzymatic or chemical cleavage, chromatographic separation of the resulting fragments, and MS-based identification of each fragment. Trypsin is the most common cleavage enzyme because it produces predictable C-terminal Lys/Arg fragments that are well-characterized in database search engines.
Fragment ion coverage of at least 70% across the sequence is the generally accepted threshold for confident sequence confirmation by MS/MS. Coverage below 50% leaves too many residues unassigned to rule out substitutions or modifications in unobserved regions.
Workflow and software
After enzymatic digestion, inject the digest onto a C18 nano-LC column and acquire data-dependent MS/MS spectra. For database searching, tools such as Mascot, Sequest (within Proteome Discoverer), or the open-source MaxQuant platform match observed b/y fragment ions to theoretical digest fragments. FindPept handles unspecific cleavage and accounts for post-translational modifications, making it useful when the cleavage pattern is incomplete or when artifact modifications are suspected.
For a known target sequence, targeted MS/MS approaches (parallel reaction monitoring, PRM, or selected reaction monitoring, SRM) are more efficient than shotgun data-dependent acquisition. PRM/SRM pre-selects the precursor m/z and monitors specific fragment transitions, giving higher sensitivity and specificity for confirmation of a single known peptide.
Pro Tip: When commissioning peptide mapping from a contract lab, specify that you want both the raw fragment ion spectra and the sequence coverage map, not just a pass/fail report. For professional independent verification, consider using EIV Diagnostics specialized services, which offer detailed peptide mapping and mass spectrometry analysis. A 68% coverage result with all critical residues assigned is more informative than a bare “confirmed” stamp.
How do you calculate theoretical mass and set acceptance criteria?
The core rule: compare observed mass to theoretical mass using the correct mass mode. Monoisotopic mass is standard for high-resolution MS identification; average mass is used for bench weighing and is often what older COAs report.
The calculation formula is: MW = Σ(residue masses) + 18.015 Da. For a five-residue peptide ACDEF, sum the monoisotopic residue masses and add water. Modifications shift the result predictably: amidation at the C-terminus subtracts approximately 0.984 Da; acetylation at the N-terminus adds approximately 42.04 Da. Many web calculators exclude unusual modifications by default, so fatty-acylated, PEGylated, or metal-chelating peptides require manual mass corrections applied on top of the calculator output.
Common adducts and their mass shifts
[M+H]⁺: +1.008 Da (protonated molecule, expected base peak in positive-mode ESI and MALDI)
[M+Na]⁺: +22.989 Da (sodium adduct, indicates incomplete desalting)
[M+K]⁺: +38.963 Da (potassium adduct, same cause as sodium)
Oxidation: +15.995 Da (most commonly methionine; also tryptophan)
Deamidation: +0.984 Da (asparagine → aspartate; requires high-resolution MS to resolve from monoisotopic M+1)
Water loss: −18.011 Da (cyclization artifact, common at N-terminal glutamine)
Acetylation: +42.011 Da (N-terminal or lysine side chain)
Acceptance criteria by instrument class
MALDI-TOF: ±1 Da from theoretical monoisotopic or average mass (instrument-dependent; confirm with the instrument’s calibration certificate). LC-ESI Q-TOF: <5 ppm. Orbitrap: <5 ppm. Any result outside these windows requires investigation before the batch is accepted.
Pro Tip: Before concluding a mass mismatch is real, confirm which mass type the instrument software reported. Bruker and Waters instruments default to monoisotopic mass for high-resolution data; some older MALDI instruments report average mass. Comparing monoisotopic observed mass to an average-mass COA value for a 2,000 Da peptide can produce an apparent discrepancy of more than 1 Da — enough to trigger a false rejection.
How do you troubleshoot common mass discrepancies?
The fastest diagnostic step is to map the observed mass shift to a known cause before changing any instrument settings or re-running the sample.
Observed symptom Most likely cause First fix +16 Da shift Methionine or Trp oxidation Re-run with fresh sample; add antioxidant (e.g., 0.1% ascorbic acid) during prep +22 Da shift Sodium adduct [M+Na]⁺ Repeat SPE desalting; use ammonium acetate wash +38 Da shift Potassium adduct [M+K]⁺ Same as sodium; check buffer and glassware −0.984 Da Deamidation or C-terminal amidation High-resolution MS to distinguish; check synthesis report >100 Da deficit Truncation or deletion Escalate to MS/MS peptide mapping Broad or unresolved peaks Aggregation, salt clusters, or multimers Dilute sample; repeat after desalting; run CE or SDS-PAGE Multiple peaks at regular spacing Charge-state series (ESI) or PEG distribution Deconvolute; confirm with known charge-state calculator No signal Ionization suppression or wrong solvent Switch ionization mode; re-prepare in 0.1% formic acid
A mass deficit greater than 100 Da almost always indicates a truncation or a completely wrong compound, not a modification artifact. In that case, HPLC purity data is irrelevant to the diagnosis — a truncated peptide with similar hydrophobicity will co-elute with the target and show a clean chromatogram while the MS reveals the discrepancy.
Pro Tip: Supplier-provided HPLC purity figures can be genuinely misleading without accompanying MS data. When requesting a COA, specify that you need the observed mass, the instrument type used, and the mass accuracy in ppm or Da. A COA that lists only “purity >95% by HPLC” with no MS data cannot confirm the compound is what it claims to be.
What belongs in a COA and internal QC record for mass verification?
A complete COA for peptide mass verification contains, at minimum: the full sequence (single-letter code), theoretical mass with explicit specification of monoisotopic or average mode, observed mass, instrument type and model, ionization mode, scan range, mass accuracy in ppm or Da, HPLC purity percentage with the chromatogram trace attached, lot number, and production date.
A COA that omits the instrument type and mass mode is not auditable. Without knowing whether the reported mass is monoisotopic or average, and which instrument produced it, the number cannot be independently verified or compared across batches.
Instrument settings to record
Document ionization mode (positive or negative), spray voltage or laser energy, capillary temperature, scan range (m/z), resolution setting, and collision energy if MS/MS data was acquired. For HPLC, record column type and dimensions, gradient program, flow rate, UV detection wavelengths, and injection volume. These parameters allow a second operator to reproduce the result on the same or equivalent instrument.
Data retention and presentation
Raw data files (Bruker .d folders, Waters .raw files, Thermo .raw files) should be archived alongside the COA for a minimum of five years for research-grade work, or longer if the data supports regulatory submissions. Spectra presented in reports should include annotated peak labels (m/z values, charge states, adduct assignments), retention time for LC data, and a clear indication of the mass accuracy achieved.
Internal QC sign-off checklist before accepting a vendor shipment
Sequence matches the order specification
Theoretical mass calculated independently (not copied from vendor COA)
Observed mass within instrument tolerance (±1 Da MALDI; <5 ppm high-res ESI)
HPLC purity trace attached and purity ≥95% (or per protocol specification)
Raw spectra files received and openable in available software
Lot number and production date recorded
No unexplained satellite peaks in MS spectrum
For a detailed breakdown of what COA elements to authenticate when evaluating a vendor shipment, the COA verification guide covers the full authentication workflow.
Concise lab protocol: MALDI spotting, LC-ESI injection, and MS/MS setup
This protocol is written for a trained technician performing routine intact-mass verification and a basic MS/MS confirmation run.
Sample preparation and MALDI spotting
Reconstitute the lyophilized peptide at 1 mg/mL in 50% acetonitrile / 0.1% TFA. Vortex 30 seconds, sonicate 1 minute.
Desalt using a C18 ZipTip or equivalent SPE cartridge. Elute in 10 µL of 70% acetonitrile / 0.1% TFA.
Prepare CHCA matrix: 10 mg/mL in 50% acetonitrile / 0.1% TFA. Mix 1 µL sample eluate with 1 µL matrix on the MALDI target plate (dried-droplet method). Allow to air-dry completely.
Calibrate the instrument externally using a peptide calibration standard covering 700–3,500 Da.
Acquire spectra: 200 laser shots minimum, laser energy set 10–15% above threshold, reflectron mode for better mass accuracy.
LC-ESI-MS injection
Reconstitute desalted peptide at 0.1–0.5 mg/mL in 0.1% formic acid / water.
Inject 1–5 µL onto a C18 reverse-phase column (1.7 µm, 2.1 × 50 mm). Injection volume should be recorded for reproducibility.
Run gradient: 5–95% acetonitrile in 0.1% formic acid over 10 minutes at 0.3 mL/min.
Acquire full-scan MS data across 200–2,000 m/z. Run duplicate injections and confirm peak retention time reproducibility (±0.1 min).
MS/MS starting parameters and instrument settings
Parameter Q-TOF starting point Orbitrap starting point Spray voltage 3.0–3.5 kV 3.0–3.5 kV Capillary temperature 300°C 320°C Collision energy (HCD/CID) 20–35 eV 25–30 eV (normalized) Scan range (MS1) 200–2,000 m/z 200–2,000 m/z Isolation window (MS2) 2–3 Da —
Archive all raw data files immediately after acquisition. Label files with lot number, date, instrument ID, and operator initials. Attach raw files to the COA before sign-off.
Pro Tip: Run a blank injection (0.1% formic acid) between samples to detect carryover. A peptide peak appearing in the blank indicates column contamination that will compromise the next sample’s purity assessment.
What should you demand from suppliers for independent mass verification?
Always require MS data on the COA. HPLC purity alone cannot detect wrong-sequence impurities because truncated or mis-sequenced products with similar hydrophobicity co-elute with the target compound. A supplier who provides only HPLC data is not providing identity confirmation, regardless of the purity percentage reported.
Missing MS data on a vendor COA is a major red flag. A peptide that shows 98% purity by HPLC but carries no MS verification could be a truncated sequence, a deletion product, or a chemically similar impurity — none of which HPLC can distinguish from the target.
Vendor COA checklist
Required fields:
Full sequence in single-letter code
Theoretical mass with explicit mass mode (monoisotopic or average)
Observed mass with instrument type and model specified
Mass accuracy in ppm or Da
HPLC purity with chromatogram trace
Lot number and production date
Raw MS spectra files (not just a screenshot)
Red flags:
COA lists only HPLC purity with no MS data
Mass mode not specified (monoisotopic vs average)
Instrument type absent or listed only as “mass spectrometer”
No raw data files available on request
Observed mass matches theoretical to exactly 0.000 Da (suggests the number was copied, not measured)
Commissioning independent verification
For independent intact-mass verification, a minimum of 1–2 mg of lyophilized peptide is typically sufficient for a standard package (intact mass by LC-ESI-MS plus HPLC purity). For MS/MS peptide mapping, request 2–5 mg to allow for sample preparation losses. Specify that you want monoisotopic mass reported and the instrument tolerance stated, so results are directly comparable to your in-house data. For guidance on evaluating supplier documentation against these standards, the supplier vetting checklist provides a structured audit framework.
When comparing vendor-provided spectra to independently acquired data, check that the mass mode, instrument class, and calibration standard are consistent. A vendor MALDI result (±1 Da) and an independent Orbitrap result (<5 ppm) are not directly comparable without converting both to the same mass mode and noting the different tolerance windows.
Pro Tip: When negotiating supplier reporting requirements, ask specifically for monoisotopic mass and the instrument tolerance used. This single request eliminates the most common source of apples-to-oranges comparisons between vendor COAs and in-house verification data.
Key Takeaways
Mass spectrometry (MALDI-TOF or LC-ESI-MS) is the only method that confirms both molecular weight and identity for research peptides; HPLC purity alone is insufficient.
Point Details Calculate theoretical mass correctly Use monoisotopic mass for high-resolution MS; average mass for bench weighing; always add 18.015 Da for the terminal water. MS is the primary verification tool MALDI-TOF (±1 Da) for fast intact-mass checks; LC-ESI Q-TOF/Orbitrap (<5 ppm) for higher accuracy and modified peptides. Desalt before every MS run Salt adducts (+22 Da sodium, +38 Da potassium) obscure true mass; SPE or HPLC fractionation is required before injection. Escalate to MS/MS when intact mass is ambiguous Fragment ion coverage ≥70% is the accepted threshold for confident sequence confirmation by peptide mapping. PeptidesFromChina coordinates manufacturer-side sourcing Products are subject to the manufacturer’s applicable quality-control procedures and specifications. Manufacturer-side analytical documentation may be available depending on the product and batch.
The gap between purity claims and actual identity confirmation
The peptide supply chain has a persistent documentation problem that most verification guides understate. Suppliers routinely report HPLC purity as the primary quality metric, and many researchers accept it as sufficient. It is not. A truncated sequence that differs by one or two residues from the target can show identical retention time on a C18 column and produce a purity trace that looks clean. The mass discrepancy only appears when MS data is examined, and that data is absent from a significant proportion of vendor COAs in circulation.
The practical consequence is that researchers sometimes run assays with peptides that are not what the label states. The failure mode is not always obvious: a truncation that removes a key pharmacophore residue may reduce biological activity without producing a visible artifact in the experiment. The researcher attributes the result to biology rather than chemistry.
Oxidation and deamidation are the two modification artifacts most commonly missed in routine QC. Both produce small mass shifts that are invisible on MALDI at standard resolution and require high-resolution ESI or MS/MS to confirm. Suppliers synthesizing at scale do not always catch these during production QC, particularly for peptides stored in non-inert conditions before lyophilization.
Batch traceability is the other gap. A COA attached to a shipment may reflect data from a different production lot if the supplier does not maintain strict lot-specific documentation. Requesting the raw MS file with the lot number embedded in the file metadata is the only way to confirm the data matches the specific batch received. For researchers evaluating whether a supplier’s documentation practices meet these standards, the peptide vendor qualification guide outlines the specific audit criteria worth applying.
PeptidesFromChina: manufacturer-side sourcing for researchers
Researchers who have worked through the verification protocol above know exactly what a complete COA looks like. PeptidesFromChina is not an independent analytical testing laboratory; buyers requiring independent verification may arrange third-party analytical testing.
The catalog covers research-grade peptides across GLP-1 agonists, longevity compounds, signaling peptides, and mitochondrial targets. Product pages include COA details so researchers can confirm the documentation format before ordering. For peptides where independent MS verification is a procurement requirement, sample quantities and verification timelines are available on request. Browse the research peptide catalog to review available compounds and their associated QC documentation, or check a specific product such as Epithalon to see how MS data and raw spectra are presented at the batch level.
Useful sources and calculation tools
The following resources support the methods, tolerances, and calculation approaches described in this article.
ExPASy PeptideMass: theoretical digest mass calculator with post-translational modification support; use for pre-run mass prediction and peptide mapping fragment matching. Accepts UniProtKB entries or raw sequences.
ExPASy FindPept: identifies peptide fragments from experimental masses, accounting for unspecific cleavage, PTMs, and protease autolysis. Use for peptide mapping interpretation when cleavage is incomplete.
Thermo Fisher Peptide Analyzing Tool: reports monoisotopic and average mass, pI, and GRAVY score. Useful pre-run check for sequence compatibility with planned MS workflows.
BenchCalc Peptide MW Calculator: clear monoisotopic vs average mass output; good for quick verification of mass mode before comparing to COA values.
PepSync Peptide MW Calculator: includes modification offsets and extinction coefficient; note that non-standard modifications (PEGylation, fatty-acylation) require manual mass corrections.
Peptide Nexus Calculator: displays m/z tables for positive and negative scan modes alongside average and monoisotopic mass; directly useful for setting ESI scan windows.
Peptide Mass Calculator v3.2 (MSToolbox): handles user-defined residues, non-standard termini, and outputs [M+H]⁺ and charge-series values for both mass modes.
PeptidesFromChina Peptide Testing Guide: method-by-method breakdown of HPLC, LC-MS, and NMR roles in peptide QC; use as a companion reference for the chromatography and MS sections above.
For quick mass calculations before an MS run, ExPASy PeptideMass and the Thermo Fisher tool are the most complete options. For fragment-level peptide mapping interpretation, FindPept handles the widest range of modification scenarios.