Peptide Efficacy Measurement: A Researcher’s 2026 Guide

Peptide efficacy measurement is the process of quantifying the maximum biological response a peptide elicits, expressed as Emax, using validated bioassays under controlled experimental conditions. This definition separates efficacy from potency, which is captured by EC50 and describes the concentration required to produce half the maximal effect. Both parameters are necessary for complete pharmacological profiling, yet they are routinely conflated in the literature. Analytical assays like HPLC and LC-MS characterize sample identity, purity, and quantity, while bioassays quantify receptor activation, signaling pathways, and cellular responses. Understanding what is peptide efficacy measurement, and how it differs from analytical characterization, is the foundation every rigorous peptide study requires.
What is peptide efficacy measurement and why it matters
Peptide efficacy measurement sits at the intersection of pharmacodynamics and experimental biology. Emax defines the ceiling of biological activity a peptide can produce regardless of dose, making it the primary metric for comparing candidates with different mechanisms of action. EC50, by contrast, tells researchers how much compound is needed to reach half that ceiling. A peptide can have a low EC50 (high potency) but a modest Emax (limited efficacy), or the reverse. Neither metric alone characterizes a compound adequately for pharmacological decision-making.
The sigmoid Emax model, derived from the Hill equation, is the standard framework for fitting dose-response data. The Hill slope describes the steepness of the curve and provides information about cooperativity or receptor heterogeneity. Assays built around this model require multi-point dose-response curves spanning 10 to 12 concentration points across 4 to 6 log units. This range is not arbitrary. Robust cell-based assays require this concentration span to accurately estimate both Emax and EC50 with acceptable pharmacological confidence.
Assay validity criteria are equally non-negotiable. A signal window greater than 4 to 5 fold between baseline and maximum response, combined with a coefficient of variation below 15% across replicates, defines a technically acceptable assay. These thresholds exist because poor assay quality can falsely distort both potency and efficacy parameter estimates, producing data that looks clean but is pharmacologically meaningless.
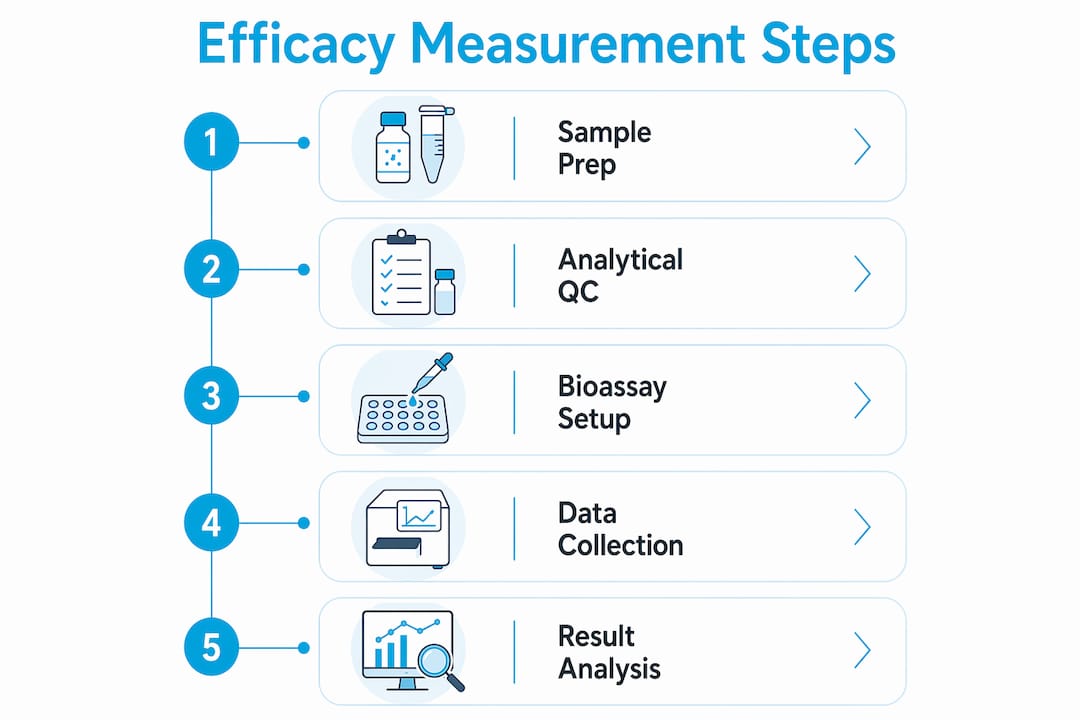
Define the biological endpoint before assay construction (receptor activation, downstream signaling, or phenotypic readout).
Select a cell line or biological system with confirmed receptor expression at physiologically relevant levels.
Prepare a minimum of 10 to 12 concentration points spanning 4 to 6 log units.
Run each concentration in triplicate across at least three independent experiments.
Fit data to the four-parameter logistic model to extract Emax, EC50, Hill slope, and baseline.
Pro Tip: Include a reference standard peptide with known Emax and EC50 values in every assay run. This controls for inter-assay variability and gives you a benchmark to detect plate-to-plate drift before it corrupts your dataset.
How analytical techniques support accurate efficacy assessment
Analytical characterization and peptide bioactivity measurement are complementary but not interchangeable. HPLC purity reports the proportion of the target peptide relative to detectable impurities in the chromatogram. It does not account for counterions, residual water, or non-UV-absorbing contaminants. Net Peptide Content (NPC) corrects for these factors and represents the true mass fraction of the active peptide in a lyophilized sample.

The practical consequence of ignoring NPC is significant. Dosage errors up to 40% can result from treating HPLC purity as equivalent to peptide content. A sample reporting 98% HPLC purity may contain only 60 to 70% actual peptide by mass when counterions and water are accounted for. This means a researcher preparing a 1 mg/mL stock solution is potentially working with a concentration 30 to 40% lower than intended, which directly distorts Emax and EC50 estimates.
The table below clarifies the distinction between the primary analytical methods used in peptide effectiveness assessment:
Method What it measures Limitation HPLC purity Relative peak area of target peptide Does not account for counterions or water Net Peptide Content (NPC) True active peptide mass fraction Requires amino acid analysis or elemental analysis LC-MS/MS Molecular identity and quantification High reproducibility (R² = 0.9995, CV <10%) but instrument-dependent Amino acid analysis (AAA) Absolute amino acid composition Time-intensive; gold standard for NPC determination
LC-MS/MS achieves high reproducibility with R² values of 0.9995 and CV below 10%, making it the preferred method for pharmacokinetic quantification in plasma and tissue matrices. For researchers using peptides like SS-31 or Ipamorelin in cell-based studies, confirming NPC before preparing working stocks is a prerequisite, not an optional step. Detailed guidance on HPLC versus NPC distinctions is available for researchers who need to audit their current sample preparation protocols.
Pro Tip: Request both HPLC purity and NPC data from your supplier before preparing any stock solution. If only HPLC data is available, treat the reported purity as an upper bound and adjust your dosing calculations accordingly.
How to design bioassays that measure peptide biological activity
Cell-based assays are the primary tool for evaluating peptide bioactivity measurement in a functional context. Receptor binding affinity data, expressed as Ki or Kd, is a prerequisite for assay design but is not equivalent to efficacy. High-affinity binding does not guarantee a high maximal biological effect. A peptide can occupy a receptor with nanomolar affinity while acting as a partial agonist with an Emax of 40% relative to a full agonist reference. Binding data informs assay design; it does not replace functional measurement.
Effective bioassay construction for evaluating peptide effectiveness requires attention to the following:
Select biological readouts that are mechanistically linked to the peptide’s target pathway. For GLP-1 agonists, cAMP accumulation is a validated primary endpoint. For mitochondrial peptides like SS-31, membrane potential and ROS production are appropriate readouts.
Match time points to the peptide’s pharmacokinetic profile. Peptides with half-lives of 5 to 15 minutes require measurement windows that capture peak exposure before degradation renders the compound inactive.
Include cytotoxicity controls at all concentrations tested. Off-target cytotoxicity at higher concentrations can suppress signal and artificially truncate the dose-response curve, producing a falsely low Emax.
Use positive and negative controls on every plate. A full agonist reference at saturating concentration defines the 100% Emax anchor. Vehicle-only wells define the baseline.
Validate assay performance across at least three independent runs before using the assay for comparative studies. Intra-assay CV below 10% and inter-assay CV below 15% are standard acceptance criteria.
Protein expression endpoints, such as Western blot quantification of downstream signaling proteins, are valid readouts but introduce additional variability compared to direct receptor activation assays like HTRF or BRET. Researchers using expression-based endpoints should normalize to a housekeeping protein and include time-course data to confirm that the measured response reflects the peptide’s pharmacodynamic window rather than a secondary or compensatory effect.
For researchers building assay protocols from scratch, the peptide biomarker research guide from PeptidesFromChina covers reporting standards and reference standard use in detail.
Common pitfalls when assessing peptide potency and efficacy
Misinterpreting potency as efficacy is the most frequent error in peptide activity evaluation. A compound with an EC50 of 0.1 nM is potent, but if its Emax is 50% of the reference standard, it is a partial agonist with limited therapeutic ceiling. Reporting EC50 without Emax provides an incomplete and potentially misleading pharmacological profile.
Several additional pitfalls consistently compromise efficacy data quality:
Ignoring NPC during stock preparation. As noted, this can introduce dosage errors up to 40%, meaning the actual concentration in every well of the assay is lower than calculated. The resulting Emax and EC50 values are artifacts of the preparation error, not the peptide’s true pharmacology.
Selecting time points without reference to peptide half-life. Timepoints beyond peptide half-life yield invalid efficacy data because systemic or media exposure has been lost. This is particularly relevant for unmodified peptides with short half-lives in cell culture media.
Running single-dose or single-time-point studies. Single-dose studies cannot differentiate sub-therapeutic from maximal responses and provide no basis for curve-fitting or parameter estimation.
Omitting pharmacokinetic data from pharmacodynamic studies. PK and PD must be integrated. Disparate plasma concentration levels rather than receptor pharmacology often explain perceived efficacy differences between structurally similar peptides.
Failing to account for formulation effects. Excipients, pH, and lyophilization conditions affect peptide stability and aggregation state, both of which alter bioavailability and receptor interaction in cell-based systems.
Pro Tip: Run a stability check on your peptide stock at the temperature and pH of your assay medium before committing to a full experiment. Peptide degradation in culture conditions is a silent confounder that invalidates dose-response data without producing any obvious experimental signal.
Key takeaways
Peptide efficacy measurement requires integrating validated bioassays, accurate sample characterization via NPC, and pharmacokinetically informed experimental design to produce pharmacologically meaningful Emax and EC50 data.
Point Details Efficacy vs. potency Emax and EC50 are distinct metrics; both are required for complete pharmacological profiling. NPC over HPLC purity Ignoring Net Peptide Content can cause dosage errors up to 40%, directly distorting assay results. Multi-point dose-response At least 10 to 12 concentration points across 4 to 6 log units are required for valid curve-fitting. PK-aligned time points Measurement windows must match peptide half-life to avoid artifacts from insufficient exposure. Assay validation criteria Signal window above 4 to 5 fold and CV below 15% are minimum thresholds for technically acceptable assays.
Why PK/PD integration defines the future of peptide efficacy research
The field has made significant progress in standardizing bioassay formats, but the gap between analytical rigor and biological interpretation remains wider than most published studies acknowledge. In my experience reviewing peptide efficacy datasets, the most common failure is not in the assay itself but in the assumptions made before the experiment begins. Researchers assume HPLC purity equals dosing accuracy. They assume a binding affinity result predicts functional outcome. They assume a single time point captures the relevant pharmacodynamic window. Each assumption introduces a layer of error that compounds through the dataset.
AI-driven peptide design accelerates candidate identification, but it cannot replace functional wet-lab validation. Computational models predict binding interactions and structural stability. They do not predict partial agonism, off-target cytotoxicity, or the impact of formulation on cellular uptake. These remain empirical questions that require well-designed cell-based assays with full dose-response characterization.
The transparency problem in peptide sourcing also directly affects efficacy data quality. A batch with undisclosed counterion content or variable lyophilization conditions produces NPC variability that researchers cannot detect from HPLC data alone. Independent batch verification, including amino acid analysis and elemental analysis, is not excessive caution. It is the minimum standard for reproducible efficacy research. The complete guide to peptides offers additional context on measurement standards for researchers working across different regulatory environments.
The direction the field needs to move is toward mandatory PK/PD co-reporting in efficacy studies, standardized NPC disclosure from suppliers, and assay validation data published alongside efficacy results. Until those standards are routine, researchers should treat any efficacy claim unsupported by multi-point dose-response data and confirmed NPC as preliminary at best.
— Sam Levin
Source verified peptides for reproducible efficacy studies
Reproducible efficacy data starts with a peptide sample whose purity, NPC, and batch consistency are independently verified before it reaches the assay plate. PeptidesFromChina supplies research-grade peptides with batch certificates that include HPLC purity, LC-MS identity confirmation, and NPC data where applicable. The catalog covers compounds directly relevant to efficacy research, including SS-31 for mitochondrial studies, Ipamorelin for growth hormone secretagogue research, and Epithalon for longevity and telomere biology applications. Each batch is sourced through direct relationships with established synthesis facilities, with traceability documentation available on request. Researchers who need verified starting material for dose-response studies can browse the full research peptide catalog to review available compounds and associated quality documentation.
FAQ
What is the difference between peptide efficacy and potency?
Efficacy (Emax) measures the maximum biological effect a peptide can produce regardless of dose. Potency (EC50) measures the concentration required to achieve half that maximum effect. Both metrics are required for complete pharmacological characterization.
Why is Net Peptide Content more important than HPLC purity for dosing?
HPLC purity measures relative peak area but does not account for counterions, residual water, or non-UV-absorbing contaminants. Ignoring NPC can produce dosage errors up to 40%, which directly distorts Emax and EC50 estimates in cell-based assays.
How many concentration points are needed for a valid dose-response curve?
A minimum of 10 to 12 concentration points spanning 4 to 6 log units is required to accurately fit the sigmoid Emax model and extract reliable pharmacological parameters. Single-dose or narrow-range studies cannot support valid curve-fitting.
Why do time points matter in peptide bioactivity measurement?
Peptide half-life constrains the valid measurement window. Assay time points selected beyond the peptide’s half-life capture responses under conditions of insufficient exposure, producing efficacy data that reflects degradation artifacts rather than true pharmacodynamics.
Can receptor binding affinity data replace functional bioassay results?
Binding affinity (Ki or Kd) indicates interaction strength but does not predict maximal biological effect. A high-affinity peptide may act as a partial agonist with a low Emax. Functional cell-based assays remain necessary to confirm efficacy independent of binding data.